
Graph T Shirts: Trendy Designs for Math Lovers
Graph T Shirts: Style, Meaning, and How to Choose the Right One
Fashion changes all the time, but some trends find a unique way to stand out. Graph T shirts are one of those trends. These are shirts with graphs, charts, data visualizations, or mathematical elements printed on them. What started as a niche item for math lovers and data geeks has now become a symbol of personality, intelligence, and even humor. Graph T shirts are more than just clothes—they are statements. They show what you love, what you believe, and sometimes, what you want to laugh about.
If you have seen someone wearing a shirt with a funny pie chart or a clever line graph, you have already experienced the charm of these shirts. But why are they so popular? Who wears them? How do you pick the best one for yourself or as a gift?
In this guide, you will get answers to all these questions and more. Whether you are a math teacher, a student, a scientist, or just someone who enjoys clever designs, you will discover the world of graph T shirts in detail.
What Are Graph T Shirts?
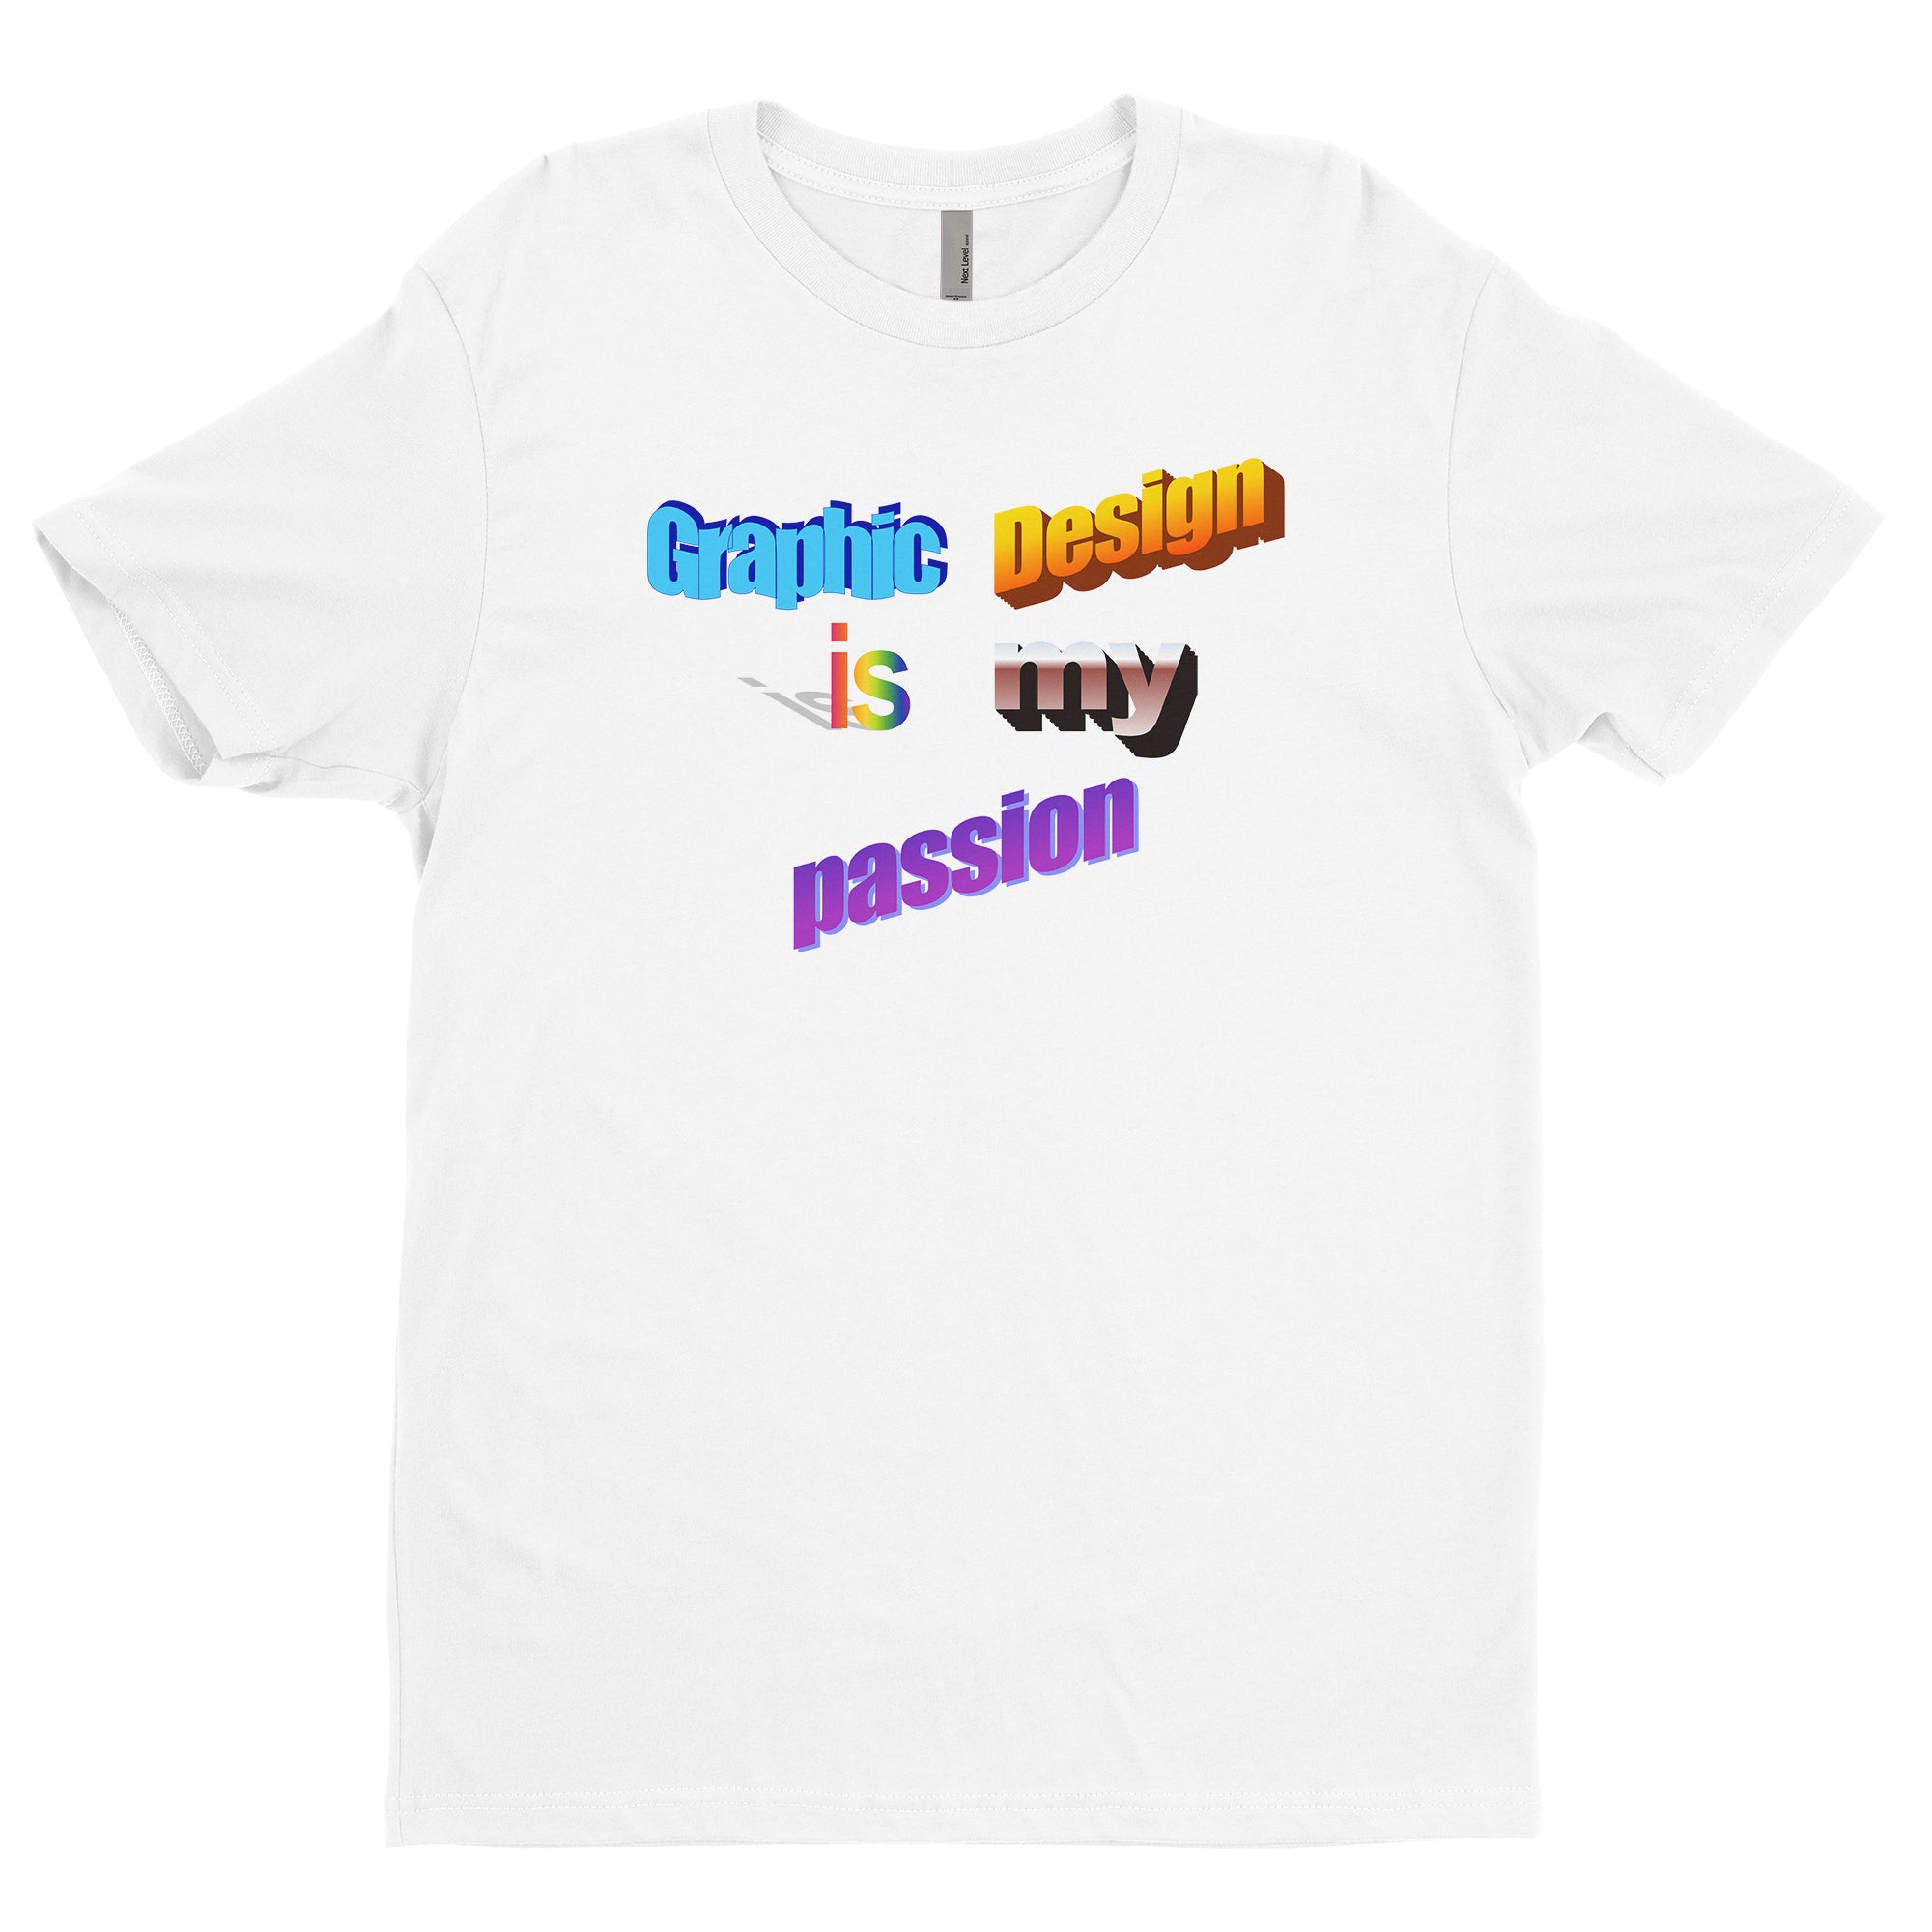
Graph T shirts are casual shirts featuring printed graphs, charts, or data visualizations. The designs can include bar graphs, line graphs, pie charts, scatter plots, mathematical equations, or infographics. Sometimes, they are educational; other times, they are just for fun.
These shirts connect directly to math, science, statistics, or even finance. They often use humor, clever puns, or relatable situations. For example, a shirt might show a pie chart labeled “My daily activities,” with most of the chart colored for “Procrastinating.
” Another might feature a line graph showing “Happiness vs. Coffee Consumption. ”
The wide variety of styles and messages make these shirts unique. They can be bold and colorful or simple and monochrome. The common theme is the use of visual data or math as the core design.
The Origins And Rise Of Graph T Shirts
Graph T shirts started in academic circles and tech communities. Professors, students, and people working in data science began wearing shirts featuring graphs as a playful nod to their fields. As data became more important in our daily lives, the designs spread to mainstream fashion.
Several factors contributed to the rise of these shirts:
- Tech culture influence: As startups and tech companies grew, their casual office styles became popular. T shirts with clever graphs became symbols of intelligence and creativity.
- Internet memes and social media: Funny or relatable graphs shared online quickly became T shirt designs.
- Pop culture: TV shows and movies featuring scientists and mathematicians made these shirts trendy.
- Growing interest in STEM fields: More people studying science, technology, engineering, and math led to greater demand for related fashion.
Now, you can find graph T shirts in online stores, college bookstores, and even in some mainstream clothing shops.
Types Of Graph T Shirts
Not all graph T shirts are the same. Their appeal comes from the wide range of styles and messages. Here are some of the most common and popular types:
1. Educational Graph T Shirts
These shirts are designed to teach or explain a concept. They may show a graph of the periodic table, a timeline of historical events, or a chart explaining a math formula. Teachers and students often wear these shirts to spark curiosity or make learning fun.
2. Humorous Graph T Shirts
One of the most loved categories. These shirts use graphs to make jokes about daily life, work, or relationships. A bar graph of “Coffee needed vs. Time of day” or a pie chart on “Reasons I’m late” (with most of the chart as “Hit snooze”) are classic examples.
3. Motivational And Inspirational Graph T Shirts
Some graph shirts encourage people to keep going or see things in a positive way. For example, a line graph showing “Success” slowly rising over “Time and Effort” can be both stylish and uplifting.
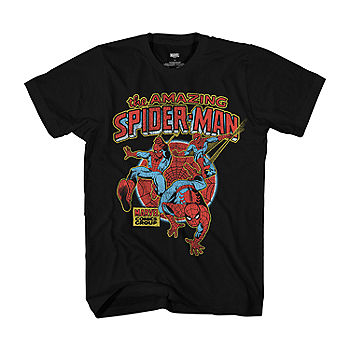
4. Pop Culture And Fandom Graph T Shirts
These shirts mix graphs with references to movies, games, or TV shows. For example, a Venn diagram showing the overlap between “Jedi” and “Lego Builders,” or a chart about “Superhero Powers. ”
5. Personalized Or Custom Graph T Shirts
You can order shirts with your own graph or data. People often use this for birthdays, anniversaries, or company events. For example, a pie chart showing “My favorite foods” with a friend’s top choices.
6. Minimalist Graph T Shirts
Simple line or bar graphs, often in black and white, appeal to those who like clean, modern design. These shirts can be worn in more situations because they look subtle and stylish.
7. Academic And Professional Graph T Shirts
These are popular among teachers, scientists, and business professionals. The graphs may show industry trends, mathematical functions, or economic data. They are a fun way to bring personality into the workplace.
8. Abstract Or Artistic Graph T Shirts
Some designers use the shapes of graphs to create art. These shirts look visually interesting even if you don’t recognize the exact data being shown.
9. Meme And Viral Graph T Shirts
These shirts use famous internet memes or viral images in graph form. For example, the “How I spend my time” meme as a pie chart on a shirt.
10. Social Or Political Statement Graph T Shirts
Graphs can be a powerful way to share opinions. Some T shirts use real data to highlight issues like climate change, gender equality, or economic inequality.
Why People Love Graph T Shirts
Graph T shirts are not just about looks. They connect with people on many levels. Here’s why they are so popular:
- Self-expression: Wearing a graph T shirt shows your interests, sense of humor, or beliefs.
- Conversation starters: People often ask about a clever or funny graph. These shirts can help break the ice.
- Education: Some shirts help teach or remind people about important facts or ideas.
- Relatable: Many graph shirts show daily struggles, habits, or joys in a way everyone understands.
- Gift potential: These shirts make unique and personal gifts for friends, coworkers, or family.
How To Choose The Right Graph T Shirt
Picking the perfect graph T shirt is about more than just the design. You want a shirt that fits well, feels comfortable, and matches your personality. Here’s a step-by-step guide to making the best choice:
1. Know Your Audience
Are you buying for yourself or as a gift? If it’s for someone else, think about their interests and sense of humor. A math teacher might love a clever equation graph, while a coffee lover would appreciate a shirt about caffeine.
2. Choose The Right Type Of Graph
Pick a graph that matches your style and message. If you want to make people laugh, go for a humorous chart. If you like subtle designs, look for minimalist options.
3. Check The Quality Of Material
Comfort matters. Most graph T shirts are made from cotton, polyester, or a blend. Cotton is soft and breathable, while polyester is more durable and keeps color well. Some blends offer the best of both worlds.
4. Look At The Print Quality
A good shirt has a clear, sharp print that doesn’t peel or fade easily. Ask if the shirt uses screen printing (best for bright colors) or direct-to-garment (DTG) printing (great for detailed designs).
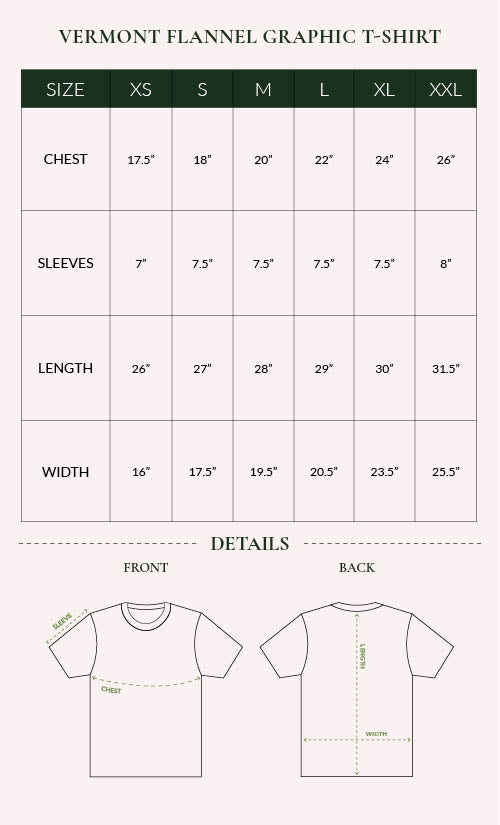
5. Consider Sizing And Fit
T shirts come in different cuts: regular, slim, relaxed, or oversized. Check the size chart and reviews before buying. If you are unsure, go one size up for comfort.
6. Think About Color
Choose a shirt color that will make the graph stand out. Black, white, and gray are classic, but bold colors can also look great.
7. Check For Eco-friendly Options
Many brands now offer shirts made from organic cotton or recycled materials. These are better for the environment and often feel softer.
8. Price And Value
Graph T shirts are usually affordable, but prices can vary. Custom or limited-edition shirts may cost more. Make sure you’re getting good value for your money—quality matters more than saving a few dollars.
9. Brand Reputation
Buy from trusted brands or sellers with good reviews. This helps avoid poor-quality materials or prints.
10. Customization Options
If you want something unique, look for brands that let you upload your own graph or data. This makes for a special gift or personal keepsake.
Common Mistakes When Buying Graph T Shirts
Even experienced buyers sometimes make mistakes. Here are a few you can avoid:
- Ignoring the size chart: Sizes can differ between brands.
- Choosing poor-quality prints: Cheap prints may crack or fade quickly.
- Picking designs that are too complex: Simple graphs are easier to read and more effective.
- Overlooking comfort: A clever shirt is no good if it’s itchy or stiff.
- Not checking return policies: Make sure you can exchange or return if needed.
How To Style Graph T Shirts
Graph T shirts can fit many different looks, from casual to smart-casual. Here are some tips:
For Everyday Casual
- Pair with jeans or shorts.
- Add sneakers and a cap.
- Keep accessories simple to let the shirt stand out.
For Work Or School
- Wear under a blazer or cardigan for a smart-casual vibe.
- Combine with chinos or dark jeans.
- Choose minimalist or subtle designs for a more professional look.
For Events Or Parties
- Use bold or colorful graph shirts to show personality.
- Pair with fun accessories, like quirky socks or statement watches.
- Layer with a denim jacket for extra style.
For Layering
- Use graph T shirts as a base under open shirts or light jackets.
- Mix with neutral layers to highlight the design.
Non-obvious tip: If you want the graph to spark conversation, wear it where people can easily read it (avoid big jackets or busy patterns over the shirt).
Caring For Your Graph T Shirts
To keep your shirts looking fresh, follow these care tips:
- Wash in cold water to prevent shrinking and fading.
- Turn the shirt inside out before washing to protect the print.
- Avoid using bleach or harsh detergents.
- Air-dry or tumble dry on low heat.
- Iron inside-out and avoid the printed area.
Many people forget that direct sunlight can fade both the fabric and the print. Store shirts in a cool, dark place for longer life.
Graph T Shirts Vs. Other Graphic Tees
You might wonder how graph T shirts compare to regular graphic T shirts. While both are about self-expression, graph T shirts have unique advantages.
| Feature | Graph T Shirts | Other Graphic Tees |
|---|---|---|
| Design Focus | Graphs, charts, data | Images, logos, slogans |
| Audience | STEM, professionals, data lovers | General public, pop culture fans |
| Message | Often educational, witty, or clever | Varies: artistic, funny, brand-based |
| Conversation Starter | High | Medium |
| Personalization | Common | Less common |
While graphic tees in general are popular, graph T shirts offer a special way to show intelligence, humor, or a love of learning.
Where To Buy Graph T Shirts
There are many places to find great graph T shirts. Here are some popular options:
- Online marketplaces: Websites like Etsy, Amazon, and Redbubble have large selections.
- Specialty stores: Some stores focus on STEM or geek culture, offering higher-quality or more creative designs.
- University bookstores: Many sell shirts designed by students or local artists.
- Custom print shops: For personalized designs, try online custom T shirt printers.
- Brand websites: Some brands have their own web shops with exclusive designs.
Pro tip: Always check sizing charts and read customer reviews before buying, especially if ordering internationally.
Credit: www.vermontflannel.com
The Role Of Graph T Shirts In Education
Graph T shirts are not just for fashion—they can be educational tools. Teachers often wear them to spark curiosity in the classroom. A shirt with a math joke or science chart can make lessons more approachable. Students may feel more comfortable asking questions or discussing topics when they see teachers use humor and creativity.
Some schools and STEM programs even design their own graph T shirts to create a sense of community. Wearing a shared design helps students feel like part of a team. In clubs or competitions, matching graph T shirts can boost morale and school spirit.
Graph T Shirts In The Workplace
As more workplaces move to casual dress codes, graph T shirts have entered offices and labs. In creative industries, tech companies, or research settings, these shirts can be a way to show your passion for your work.
Some companies give out custom graph T shirts at events, conferences, or product launches. Employees may wear shirts featuring data about company achievements or industry trends. This not only builds pride but can also make a brand stand out.
How Graph T Shirts Make A Statement
Wearing a graph T shirt is more than just putting on clothes. It’s a way to share your personality, beliefs, or interests without speaking. For example:
- A climate scientist might wear a shirt showing a temperature rise graph to raise awareness.
- An introvert could wear a pie chart on “How I spend my weekend” to show their love for quiet time.
- A business professional could sport a bar graph of “Coffee vs. Productivity.”
These shirts let you connect with like-minded people. If someone laughs at your shirt, you know you share a similar sense of humor or interest.
How To Design Your Own Graph T Shirt
Creating your own graph T shirt is easier than ever. Here’s how you can do it:
- Choose your message: Decide what you want your graph to say. Make it personal or funny.
- Design the graph: Use free online tools like Canva, Google Charts, or Excel. Keep the design simple for best results.
- Pick your shirt style and color: Lighter colors make dark graphs pop, and vice versa.
- Upload your design: Use a print-on-demand service or local print shop.
- Check a preview: Make sure the graph is readable at T shirt size.
- Order a sample: Before ordering many shirts, get one to check quality.
Advanced tip: Use vector graphics for the best print quality. Avoid too much small text or overly detailed charts.
Sustainability And Ethics In Graph T Shirts
With growing concern for the environment, many buyers look for eco-friendly graph T shirts. Here’s what to consider:
- Organic cotton: Uses less water and fewer chemicals.
- Recycled materials: Some shirts use recycled polyester or blends.
- Fair labor: Buy from brands that pay fair wages and have ethical factories.
- Low-impact dyes: Some prints use water-based inks that are better for the planet.
Choosing sustainable options not only feels good but can also make a positive impact. Some brands publish detailed information about their materials and production process. If this matters to you, look for certifications or third-party audits.
For more on sustainable fashion, visit Fashion Revolution.
The Psychology Behind Graph T Shirts
Why do these shirts make such an impression? The answer lies in visual thinking. People process images and data faster than text. A clever graph can make people laugh or think within seconds. It’s also a way to show that you value information and logic.
Many people who like graph T shirts also enjoy puzzles, logic games, or solving problems. Wearing these shirts can signal to others that you’re part of this community. It’s a way of finding your “tribe” in a crowd.
Another reason is that graphs often simplify complex topics. A good graph T shirt can communicate an idea that would take paragraphs to explain.
Credit: www.jcpenney.com
Graph T Shirts As Gifts
If you’re looking for a unique gift, graph T shirts are a great choice. Here’s why:
- Personalization: You can tailor the graph to the recipient’s interests.
- Practical: Everyone wears T shirts, so it’s useful.
- Conversation starter: The recipient will enjoy explaining their shirt to others.
- Lasting value: A well-made shirt lasts for years.
When giving a graph T shirt as a gift, consider adding a note explaining the graph if it’s an inside joke or niche reference. This makes the gift even more special.
Current Trends In Graph T Shirts
Fashion never stays the same, and graph T shirts follow trends too. Here are some current directions:
- Retro and vintage graphs: Old-school charts or data from the past, styled to look classic.
- Data activism: Shirts showing real-world data about social or environmental issues.
- Interactive designs: Some shirts use QR codes that link to interactive graphs online.
- Augmented reality: A few brands experiment with AR, where a graph comes alive through an app.
- Mixed media: Combining embroidery or patchwork with printed graphs for a textured look.
Emerging insight: Some artists now use hand-drawn graphs for a more personal, less digital feel.
Credit: www.tb4a.com
Graph T Shirts In Pop Culture
Graph T shirts have made appearances in TV shows, films, and social media. They’re often used to show that a character is smart, quirky, or passionate about something. Celebrities and influencers have also worn them, making certain designs go viral.
The use of these shirts in media helps break down stereotypes about math or science being boring. When cool characters wear graph T shirts, it can inspire others to be proud of their own interests.
How To Spot A Fake Or Poor-quality Graph T Shirt
With popularity comes imitation. Not all graph T shirts are made equal. Here’s how to avoid bad buys:
- Check the print: Blurry or off-center prints are a bad sign.
- Feel the fabric: Thin, rough materials may not last long.
- Look for misspellings: A real graph should have correct labels and data.
- Ask about return policy: Reliable sellers offer easy returns.
- Avoid too-good-to-be-true prices: Very cheap shirts are often low quality.
Quick Comparison: Top Graph T Shirt Materials
Understanding shirt materials helps you choose the best option.
| Material | Comfort | Durability | Print Quality | Eco-friendly? |
|---|---|---|---|---|
| Cotton | Very soft | Good | Excellent | Organic options available |
| Polyester | Less soft | Very high | Good | Recycled options available |
| Blends | Soft & stretchy | High | Very good | Depends on blend |
| Bamboo | Very soft | Medium | Good | Yes |
Insider tip: Blends of cotton and polyester often give the best mix of comfort, durability, and print quality.
The Future Of Graph T Shirts
The world of graph T shirts keeps evolving. As data becomes even more important in business, education, and personal lives, these shirts will stay relevant. New printing technology allows for more detailed and colorful designs. Customization will become even easier, so anyone can turn their favorite data into wearable art.
We may also see more collaboration between artists, data scientists, and environmental groups. This could lead to shirts that not only look good but also tell important stories.
Frequently Asked Questions
What Is A Graph T Shirt?
A graph T shirt is a casual shirt printed with a graph, chart, or data visualization. The design can show a joke, fact, or personal message using visual data.
Who Usually Wears Graph T Shirts?
People in STEM fields, teachers, students, and anyone who enjoys data or clever humor often wear these shirts. They are also popular with fans of pop culture and unique fashion.
How Do I Care For My Graph T Shirt?
Wash in cold water, turn inside out, avoid harsh chemicals, and air-dry if possible. This keeps the print looking fresh for longer.
Can I Design My Own Graph T Shirt?
Yes, many online services let you upload your own graph or data. This is popular for gifts, events, or making a personal statement.
Are There Eco-friendly Graph T Shirts?
Yes, some brands use organic cotton, recycled materials, or water-based inks. Look for brands that share details about their sustainability practices.
Graph T shirts are more than a passing trend. They are a creative, intelligent way to show who you are, spark conversations, and even inspire others. Whether you buy one or design your own, you’re wearing a piece of data-driven art that makes the world a little more interesting.